April 3, 2026

If you launch an employee recognition program that’s tailored to specific strategic goals and successfully engages your workforce, then signs of its impact will naturally appear.
Peer recognition may be improving collaboration across departments, or managers who regularly recognize their teams report higher morale. While these developments are great, they do not, on their own, build a business case for your program.
You might see improvements on the ground, such as more colleagues brainstorming together, or your teams seeming more connected and motivated at work. However, these aren’t quantifiable metrics that show leadership how recognition is paying off.
For that, you need to dig deeper and track quantifiable metrics that can be linked to financial gain, such as:
- Employee turnover rates—can you show that recognition increases employee retention across specific segments, such as new hires or employees with over 5 years of tenure? Does manager recognition affect turnover within particular teams?
- Productivity gains and KPIs—whether that’s production goals, sales quotas, customer service KPIs, or patient care objectives.
This is where proving value gets tricky, because it’s not enough to track these metrics alone. You have to establish a clear link between changes in these metrics and recognition, quantify the estimated contribution, and present your findings in a way that convinces leadership there’s ROI.
To help you out, we’ve put together this practical guide. It takes you through everything you need to know about measuring employee recognition, including how to:
- Measure employee engagement—with a scientific framework that quantifies the impact of recognition on your workplace culture.
- Link employee recognition program performance to KPIs that serve the business—such as turnover rate, absenteeism, safety, and performance metrics (e.g., first call resolution, closed deals, etc.)
- Build a business case for your program—by combining findings from quantitative and qualitative sources and evaluating the financial contribution.
We’ll also show you how to automate the entire process of designing employee recognition programs, tailoring them to strategic objectives, tracking performance, and proving ROI with Terryberry’s all-in-one employee recognition software.
You can schedule a demo today for a live walkthrough.
Our 3-Step Framework for Measuring Employee Recognition’s Impact
When you’re researching how to measure employee recognition, you’ll likely come across organizations and research bodies with their own frameworks, guidelines, and recommended methods for measuring recognition’s impact.
We’re going to specifically focus on the steps we’ve used to help over 40,000 companies measure the impact of employee recognition. Our framework is based on both practical learnings and our science-backed culture model for quantifying employee engagement and predicting turnover.
1. Determine What You’ll Measure (And How)
When you set out to measure the impact of employee recognition, keep in mind that recognition can affect employees in different ways. Since each employee has their own intrinsic motivations and experiences your culture differently, their response to recognition and any other engagement initiatives varies.
To better understand this, let’s consider employee retention and how recognition may affect it. What makes employees stay or leave? Exit and stay surveys can reveal specific but varied insights, such as how manager recognition matters more to some employees than others. In contrast, others prioritize professional development opportunities and strong relationships with their coworkers.
While these surveys can help you uncover common themes, they aren’t enough for forecasting or preventing turnover. Because you do not know which of these reasons, if any, may drive your remaining employees to leave, and you cannot predict with precision who is prone to churn and why.
Now, a recognition program might significantly improve retention for some groups but be less effective across others. What makes the difference here is the underlying factors that motivate different groups of employees to stay.
Understanding these factors is key to making a stronger case for recognition’s impact on “hard” metrics—such as turnover rates, absenteeism, and productivity.
For example, if you have data that shows manager recognition boosts people’s sense of purpose, which is linked to higher eNPS, then you can make your case.
Moreover, understanding these motivations can help you understand where the program is succeeding, where improvements are needed, and how to drive change. If recognition isn’t building safety habits or boosting retention at a specific facility, you can identify the root cause and adapt your program accordingly.
That’s easier said than done, though. Most companies that we work with face this challenge initially. They have some sense of what motivates and engages their workforce, but measuring these factors, spotting trends, and quantifying their impact remains elusive.
That’s where our culture model comes in. With the help of three independent PhD researchers, we developed a model based on six engagement indicators that precisely measure your culture’s impact on engagement and, by extension, its impact on metrics such as employee burnout, absenteeism, and retention.
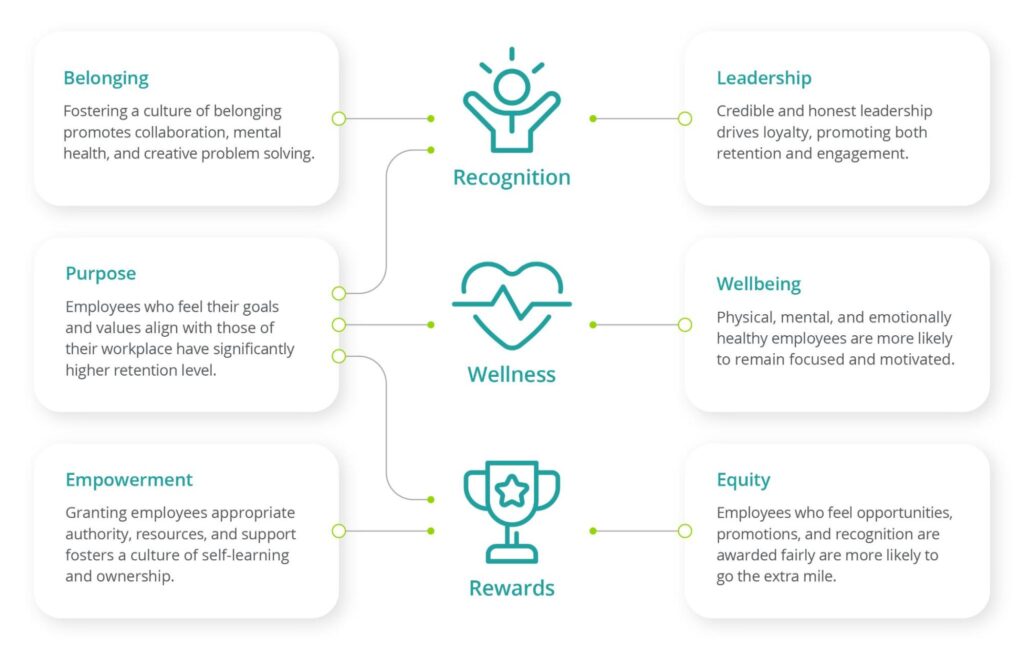
The six engagement indicators (shown in the diagram above) contextualize the impact of your company’s culture on employee engagement. So, for example:
- People feel a strong sense of purpose when they see how their work and values align with company goals. This, in turn, boosts employee loyalty.
- People feel strongly connected to their leaders when they can reach out to them and feel supported and recognized.
In the diagram above, you’ll notice how recognition is linked to three indicators—leadership, belonging, and purpose. That’s because our research establishes that employee recognition directly impacts these three engagement indicators. However, these three factors can, in turn, affect other engagement indicators (for example, as we discuss later, some companies observe a relationship between employee recognition and well-being).
Since employee engagement affects the other factors you use to measure recognition’s impact, such as productivity, adherence to safety goals, and retention, the engagement indicators become fundamental KPIs to track.
This brings us to the “how to measure” part. For quantifiable metrics, you’ll need to use surveys such as eNPS, employee experience and satisfaction, and engagement. The PhD researchers who developed our culture model also designed science-backed engagement surveys to quantify these factors.
The most fundamental of these surveys is our employee engagement baseline survey, which measures and scores all six factors on a Likert scale. For example:
- Scoring +30 in equity but -5 in well-being may indicate that some employees are struggling with fatigue or burnout, although people are generally satisfied with the opportunities at your organization.
- Low “leadership” and “empowerment” scores may signal that people don’t feel connected to their managers/direct supervisors or supported in their roles.
Then, you can combine insights from these employee engagement surveys with:
- Retention scores from eNPS surveys. Examine the relationship between the two. Which engagement indicators contribute most to overall retention? What indicators do your churn-prone groups score the lowest in?
- Insights from surveys that offer more context. For example, say you uncover a group that doesn’t see themselves working at your company past 6 months (based on eNPS surveys), and they’re scoring low in leadership and empowerment. You can follow up with engagement drill-down and employee satisfaction surveys to investigate the root cause.
- Qualitative research methods. Holding 1:1 interviews with regular employees and managers, setting up focus groups, and running open-ended surveys (anonymous feedback boxes can be effective) are all ways to capture qualitative insights that add more context to your quantitative findings.
While quantitative data helps you prove the impact of recognition in its own right, it also paves the way for contextualizing qualitative insights that you gather.
2. Track Program Performance and Engagement
Once you are clear on what you will measure and how, the most surface-level way to gauge recognition’s impact is to track changes in KPIs before and after launching your program. This can be engagement indicator scores, turnover, or sales quotas.But this is far from ideal because several factors could explain changes in those KPIs, so you can demonstrate a loose correlation at best.
You need to establish a stronger link, and that is where program participation metrics come into play. Tracking program participation introduces natural segments to your workforce based on recognition. So you’ll have groups of employees who receive the most recognition (highly participatory) and those who receive little to none (low participation).
Then, you can draw averages and benchmark participation rates as either above or below average. And then you can introduce an entirely new dimension by distinguishing between sent and received.
If your program is monetized, tracking how recognition budgets are used offers another perspective on participation. For instance, if you were to allocate 10,000 points per branch or department each month, then the department that allocates all 10,000 points is the most engaged in meaningful recognition activities, while your least engaged department may only award 3,000.
Now, with segments that distinguish recognition, you can compare KPIs across these groups to build a more convincing case for recognition’s impact. Are eNPS scores higher for groups that receive more recognition? What’s the relationship with engagement indicator scores?
As we discussed earlier, recognition (and your company’s culture as a whole) can impact people differently. It’s important to identify common themes in engagement and participation across groups.
For example, if employees with five years of tenure are overrepresented in your least recognized group, you’d want to investigate the root cause. You might ask questions like:
- Are they not given enough opportunities to be recognized?
- Is the program not tailored to their responsibilities?
- What engagement scores are they high and low in?
- What’s their average eNPS?
Your recognition program is most likely to succeed when it engages your entire workforce. That’s why tracking participation metrics at both the company level and across different cohorts is important. This includes:
- The number of employees who participate in the program
- The percentage of employees who stay involved and active in recognition after initial participation
- Average program participation over time
- Manager participation
Then, you can compare participation across different groups to spot trends and uncover gaps in your program:
- Employees who work different shifts
- Employees from different departments
- Employees with the same tenure
- Employees in the same age group
- Employees under a specific manager
If some groups are underrepresented in your recognition program, you can use employee listening to identify barriers to participation, gaps in how the program supports their microcultures, and whether manager engagement is contributing to the issue.
Read more: Our detailed guide on How to Launch & Scale an Employee Engagement Program covers the fundamentals of maximizing participation in engagement programs.
3. Bring Everything Together & Build Your Business Case
As we mentioned earlier, the key to building a business case for your recognition is to combine the right insights from employee listening with recognition program participation data. Now that we’ve laid out the fundamentals of what to track and how, we’ll walk you through bringing everything together and quantifying the financial impact.
By “bringing everything together,” we mean you need a unified dataset that captures both your workforce's participation in employee recognition and their survey responses. For example, you should be able to:
- Pull up the eNPS scores for your most and least recognized employees.
- Compare engagement indicator scores between teams whose managers regularly give recognition and those whose managers don’t.
In practice, this means using a unified system that enables you to run employee recognition programs and surveys while centralizing these two datasets in the backend.
To get into the finer details of proving the financial impact of recognition, let’s assume this setup is in place (we also explain how Terryberry handles all this in the next section) and that the system supports cohort analysis and budget tracking.
Now, you’d use different participant filters to compare engagement indicator scores, eNPS, and your KPIs across groups with varying levels of program participation. Then, you can attribute these metrics to a financial value and present the potential for further cost savings.
We’ll show you how to do this using examples below—starting with retention (since this applies to all industries) and then covering more niche scenarios.
Recognition’s Impact on Retention
The starting point here is to demonstrate the relationship between eNPS and your recognition program. There are several ways to do this, such as by comparing the eNPS scores of:
- Most and least recognized employee groups
- Teams with managers who frequently give recognition vs. teams whose managers rarely (or never) recognize team members
- Comparing the eNPS scores of teams, departments, or facilities that top the charts in points allocation
However, depending on how your program is structured, you may view retention from different perspectives. For example, let’s consider two milestone recognition programs:
- New hire turnover. This is a popular program type in industries such as healthcare and retail, where new-hire turnover is frequent and costly.Here, your milestone program would cover all new hires, so you wouldn’t be able to compare eNPS scores between the most- and least-recognized. Instead, you’d track improvements in eNPS scores and changes in the turnover rate before and after the program was launched.
- Years of service awards programs. The objective of these programs is typically to boost loyalty and long-term tenure—e.g., three or five years and above. So you’d track long-term retention and compare eNPS scores across employee tenure bands (e.g., 3-10 years). Losing tenured employees is typically more expensive for an organization, not only because recruitment costs are higher for senior roles but also because of the loss of institutional knowledge and mentorship.
Recognition’s Impact on Performance Outcomes & Productivity
For recognition programs tailored to specific performance outcomes—such as improving patient care, enhancing customer service, or meeting sales quotas—you need to quantify their impact on productivity.
For goals like sales quotas, this is a relatively straightforward practice. You can compare quotas:
- Before and after the launch of the recognition program. Has there been an increase in overall sales per employee?
- For the groups of most- and least-recognized employees. What’s the overall difference?
Then, you just need to multiply the difference by the average contract value to gauge the financial impact.
If you’re tracking metrics such as patient care or average handling times, you’d need to assign a financial value to them. So, for example, let’s take patient care—because there are several things to consider here.
First, what are the different ways that you’re measuring patient care and its impact? Patient satisfaction scores, NPS, and turnover rates are the starting point, but are you also tracking reinfection or readmission rates? Numerous studies (such as this one) have found that reducing rates like readmission boosts financial performance.
Again, the issue is linking recognition to these outcomes by tracking how metrics change over time (pre- and post-recognition) and comparing results across groups with different levels of recognition.
You’ll rarely get a precise dollar value that perfectly captures the impact of recognition on patient care, customer service, or even sales (because so many other factors can affect these). But tracking the full scope of recognition’s impact is enough to make a strong case to leadership, such as:
“Patient retention is up, readmission rates are down, and here’s how we know recognition is contributing to it. We’ve estimated the value of this contribution at $x based on…”
Recognition’s Impact on Workplace Safety
Whether you are in retail, logistics, or healthcare, a lack of workplace safety can be costly because accidents, injuries, and damaged equipment all carry financial impact.
So if you have safety recognition programs in place—e.g., ones that reward zero-accident streaks or recognize employees for following safety protocols—then tracking the right metrics can help you quantify their financial impact.
First, you need to determine the dollar value of each incident using historical data on accidents, injuries, damaged equipment, and other past incidents.
Then, there are different ways to quantify value, including:
- Measuring the number of incidents—accidents, injuries, etc.—before and after the launch of the program. Multiply the change in the number of incidents by the cost of each one—the result is how much you’ve saved thanks to the program.
- Comparing the number of incidents from a facility, department, floor, or team that’s highly engaged in the program with the least engaged one. Here, you can refer to points allocations to easily work out which groups are the most and least engaged. Then, as above, you can multiply the difference in incidents by the cost of one. This approach offers insights into how much more can be saved by engaging different segments of your workforce.
Uncovering New Opportunities
As we’ve discussed above, you can build a stronger case for recognition programs (like safety initiatives) by not just showing how much they’ve saved you, but how much more they can as well.
In these cases, tracking engagement indicators alongside eNPS and program metrics can help you chart a course for achieving these additional savings. You can compare the scores of your most and least engaged groups to identify key gaps, such as low well-being or empowerment scores. Then, you can use additional surveys and qualitative methods to capture more context about the root causes.
When you compare these scores across different groups, it’s possible to discover a negative relationship between recognition and engagement amongst some groups. For example, some companies we’ve worked with have observed a decline in eNPS and well-being scores among their “most recognized” employees.
After investigation, the root cause is usually along the following lines:
- The employee joined the company in a role that they’re especially passionate about
- Over time, they’ve taken on more responsibilities. As they’re recognized for their contributions, their responsibilities have continued to evolve.
Consequently, they end up in roles with responsibilities that they’re not passionate about—and are overwhelmed by—which leads to burnout and, ultimately, voluntary turnover. In this scenario, although recognition surfaces the gap, it’s not the root cause. What needs to be addressed is how employees are assigned more responsibilities and promoted.
Here, you can highlight these findings, estimate the cost of losing these top performers, and share suggestions to boost retention.
Manage Your Entire Recognition Strategy with Terryberry
Terryberry is an all-in-one employee engagement solution that brings employee recognition, rewards, listening, and wellness together in one place.
Thousands of businesses use Terryberry’s employee recognition software to quantify the business impact of recognition and generate leadership-ready reports in days, not weeks or months.
In the following sections, we’ll take you through how Terryberry:
- Streamlines the entire process we’ve discussed
- Automates time-consuming admin work
- Maximizes program participation
- Centralizes analytics from across all your engagement programs
Track Recognition and Manage All Your Programs in One Place
Terryberry’s employee recognition software lets you launch programs tailored to specific strategic objectives, whether that’s promoting core values, boosting retention rates, increasing workplace safety, or recognizing distinguished performance.
Our system supports:
- Manager recognition—empower managers to recognize their teams on the spot and track team participation, recognition given, and budgets with centralized dashboards.
- Peer-to-peer recognition—bring your entire workforce into the game. Peers can recognize each other for great work, demonstrating company values, supporting their team members, or any other recognition goals you set.
- Nomination-based programs—customize nomination and approval workflows to configure programs like employee of the month, team MVP, and even industry awards like the DAISY (for nurses).
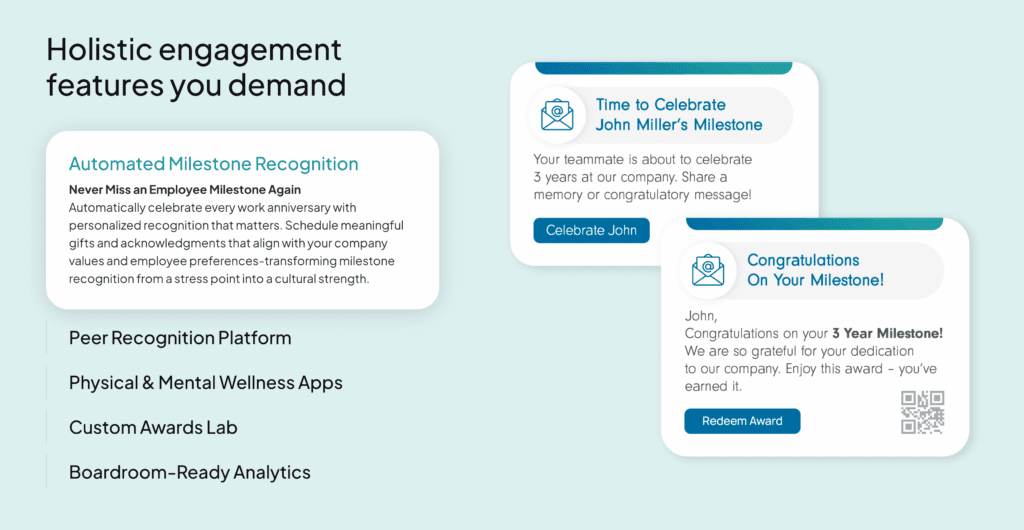
- Milestone recognition—celebrate big wins and personal moments with automated milestone programs for birthdays, first-year achievements, work anniversaries, safety streaks, and more.
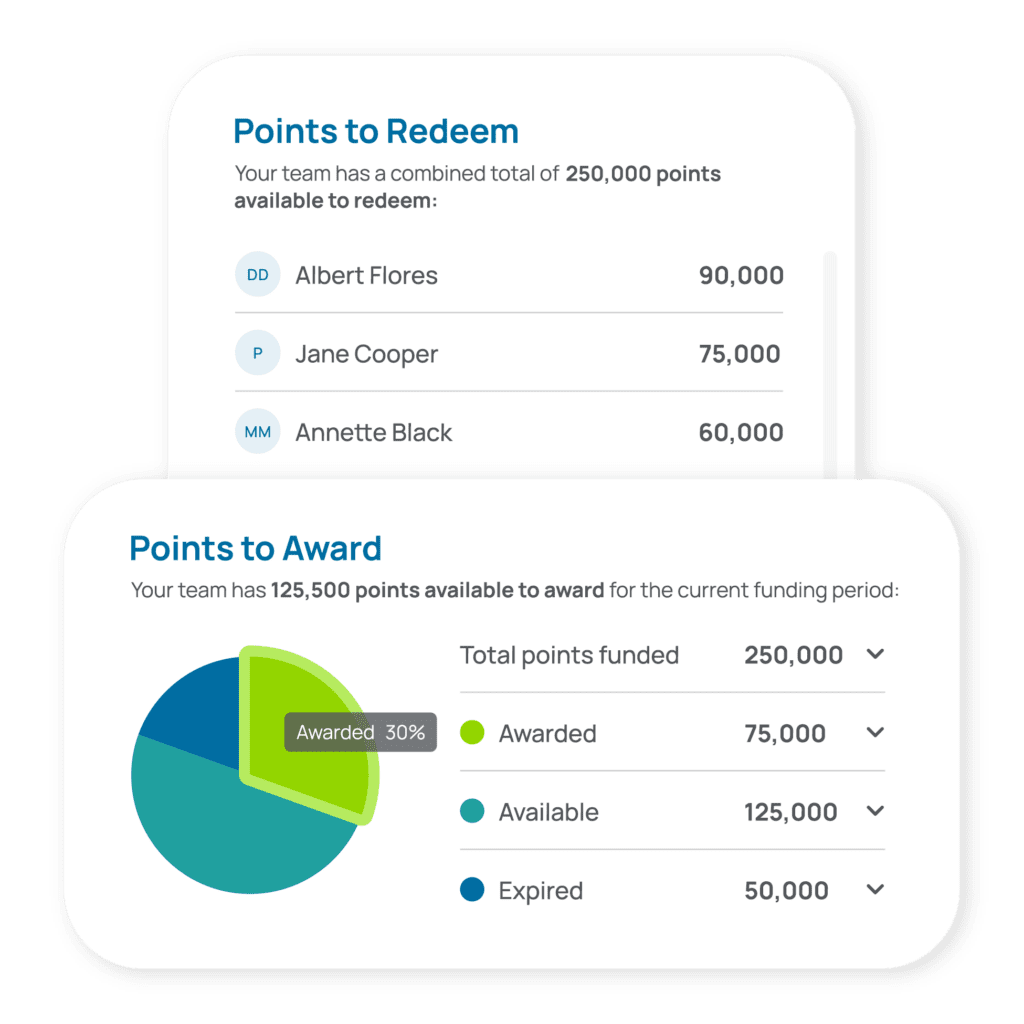
- Monetized and unmonetized programs—keep recognition unmonetized or use Terryberry’s integrated rewards system to set up points-based programs, track budgets, and deliver personalized incentives. You can also set up custom rewards tiers using Terryberry’s “Recognition Levels”—a popular choice for milestone programs.
With Terryberry, you can also deliver these programs across multiple channels and tailor them to your workforce’s unique microcultures to help maximize participation. We support a range of offline and online recognition options through our mobile app, MS Teams and Outlook integrations, offline presentation kits, code-based rewards redemption, and custom setups (e.g., recognition on kiosks).
As employees adopt and engage in recognition, Terryberry’s Recognition Analytics provide a snapshot of key performance metrics and deeper insights into employee engagement:
Our system also tracks participation stats, rewards redemptions, and budgets across all of your recognition programs. You can drill down into the specific stats of each program from your centralized reporting dashboard.
Managers can track these metrics at the team level from their personalized dashboards:
Measure Retention, Engagement, and More
We designed Terryberry’s employee listening tool—Be Heard—to help organizations capture employee feedback, track engagement, and measure retention at scale.
✅ Get surveys off the ground quickly. Instead of designing surveys from scratch, you can choose from dozens of pre-built templates in our library, including science-backed employee engagement baseline, retention drill-down, new-hire, exit, stay, ad hoc surveys, and more. Alternatively, you can generate custom surveys for more niche needs using our AI-powered survey builder.
✅ Maximize survey participation. Be Heard supports survey delivery via desktop, mobile app, QR codes, links, and even paper. We also help you design engaging survey communications and recommend optimal follow-up timing (based on internal research) to maximize participation.
✅ Ensure people share how they really feel. We ensure all responses are anonymous (and stay that way) with third-party encryption and a 6-response minimum threshold (if fewer than six people in a group responded, you can’t view these scores directly, but the data is included in aggregate scores).
✅ Say goodbye to tedious manual work. Be Heard automatically sends reminders to fill in surveys, collects responses across all channels, processes the results, and delivers any scheduled follow-ups.
✅ Track participation metrics. Be Heard displays completion rates in real-time, with breakdowns by department, location, and tenure.
✅ Spot trends and opportunities with powerful cohort analysis. Terryberry’s survey analytics dashboard includes filters to break down engagement indicator scores and eNPS by department, age, gender, generation, facility, job title, seniority level, and more. With multiple score views, you can analyze the same data from different angles and quickly spot problem areas using visual response distribution charts with scoring from -100 to +100.
“Terryberry was the only solution that helped us transform raw data into concrete decisions that impact the lives of our employees, our business, and our community. That's what's really driven our loyalty. With Terryberry, we can now spot long-term trends and see the impact of our choices over the past 5 years. This insight allows us to make informed decisions and address issues proactively."
- Dan Norris, VP of Talent Development at a 3-billion-dollar construction manufacturing company. Read the full case study here.
Build Your Business Case with Centralized Analytics
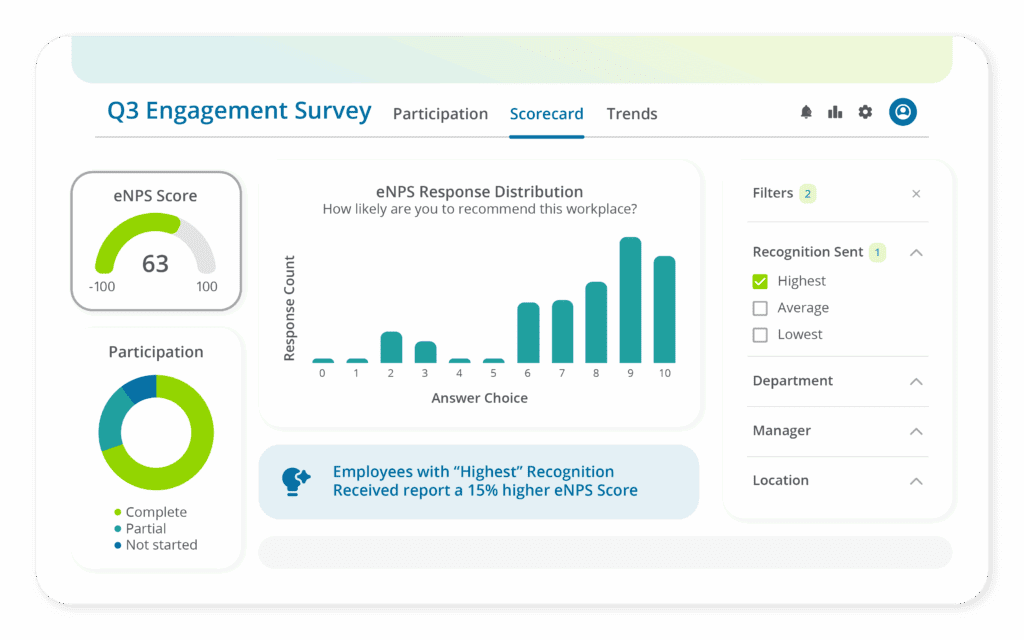
As employees participate in your recognition programs and submit survey responses, the data from these programs flows into Terryberry’s centralized analytics dashboard. From here, you can use different response views and participant filters to prove recognition’s impact on retention and engagement.
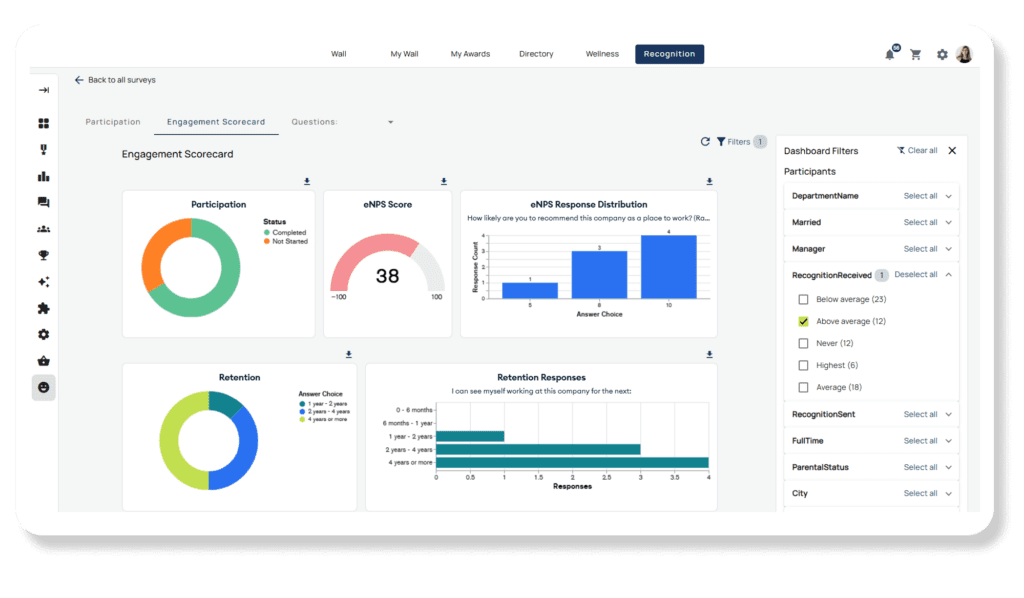
As shown in the screenshot above, our centralized dashboards include:
- General participant filters
- Recognition-specific filters, including “Recognition Received” and “Recognition Sent”.
- Retention response distributions—from 0-6 months to 4 years or more.
You can also navigate across different views to dig deeper into key metrics:
- Engagement Scorecard: View eNPS and retention scores side-by-side with consistent filtering
- Likert view: Individual question scores with heat mapping
- Indicators view: Rollup scores across the 6 engagement indicators
By bringing all relevant data together in one place, these dashboards allow you to measure the impact of recognition from multiple perspectives. You can mix and match filters to understand how recognition affects engagement, retention, and outcomes across segments of your workforce.
So, for example, you can compare the eNPS scores of the “highest recognition received” group with those of “below average” and “never”. Then, if the “highest” group reports a 15% higher eNPS, you can calculate the financial impact (using the method we discussed above).
Build Your Case for Employee Recognition
Measuring the impact of employee recognition isn’t a precise science, and limiting it to quantifiable metrics—like turnover—risks overlooking its broader impact. If you’re not also tracking the underlying factors that impact these metrics, you can’t see the complete picture of what recognition is changing, why people are responding to it differently, and what more you can achieve for the organization.
That’s why our framework for measuring employee recognition is centered around Terryberry’s culture model for employee engagement. It tracks the full spectrum of recognition’s impact, surfaces gaps in your program, and helps you accurately measure not just return on investment (ROI) but the potential for unrealized savings.
However, tracking how KPIs evolve over time and building a strong case for your recognition efforts are tedious, time-consuming tasks. Without the right systems in place, accurately tracking data and bringing it all together is challenging.
That’s where Terryberry’s employee recognition platform can help. Our fully integrated platform supports all aspects of managing employee engagement programs, while our centralized analytics let you track impact in real time and build leadership-ready reports in a few hours.
Schedule your personalized demo to see how Terryberry can help you launch tailored recognition programs, measure retention and engagement, and secure leadership buy-in.